
Isometric Graph Drawing
Attract attention by presenting your data in an isometric view
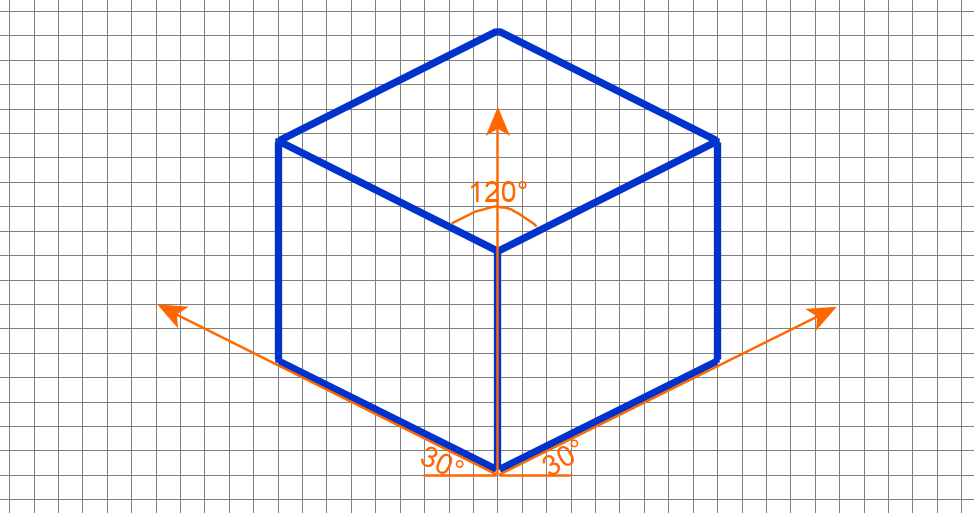
An Isometric Drawing is a special 2-dimensional representation of a 3-dimensional object without perspective shortening.
In an isometric drawing, each pair of coordinate axes forms a 120 degree angle. So vertical lines are always vertical, while an axis-aligned horizontal line form 30 degree angles with the horizontal plane. The most important criterion is that all parallel lines of the object remain parallel in the final drawing.
Isometric drawings are considered to be pictorial images, and they have many advantages in comparison to the typical 2-dimensional drawings since they reveal clearly and unambiguously the dimensions of the represented shapes. They are commonly used by engineers, illustrators, or architects to communicate their designs in such a way that their dimensions are comprehensive also to people that have no technical knowledge or experience.
Automatic Creation of Isometric Drawings
There exist several tools that can automate the process of creating isometric drawings. Most of them are designer tools like Inkscape, AutoCAD, Adobe Illustrator CC, QCAD, or DraftSight used for manually creating 2D- or 3D-drawings. However, there exist also use case scenarios where the users already have diagrams that are hard to be manually created, and they would also like to display them as isometric drawings. In such cases, being able to automate the process of isometric drawings is a fundamental task.
yFiles is a commercial software library that supports creating, visualizing, editing, and analyzing graphs. It provides an extensive set of predefined styles for visualizing the graph elements, i.e., the nodes (vertices), the edges (links), or the labels of a graph drawing, while it also supports the creation of user-defined custom styles. yFiles also comes with a complete set of layout algorithms for arranging the graph elements based on the user’s needs. For isometric drawings, users can create their desired isometric styles for the graph elements and arrange them on the screen with small implementation effort by appropriately translating and projecting the results of any layout algorithm on the plane.
Example and Source Code
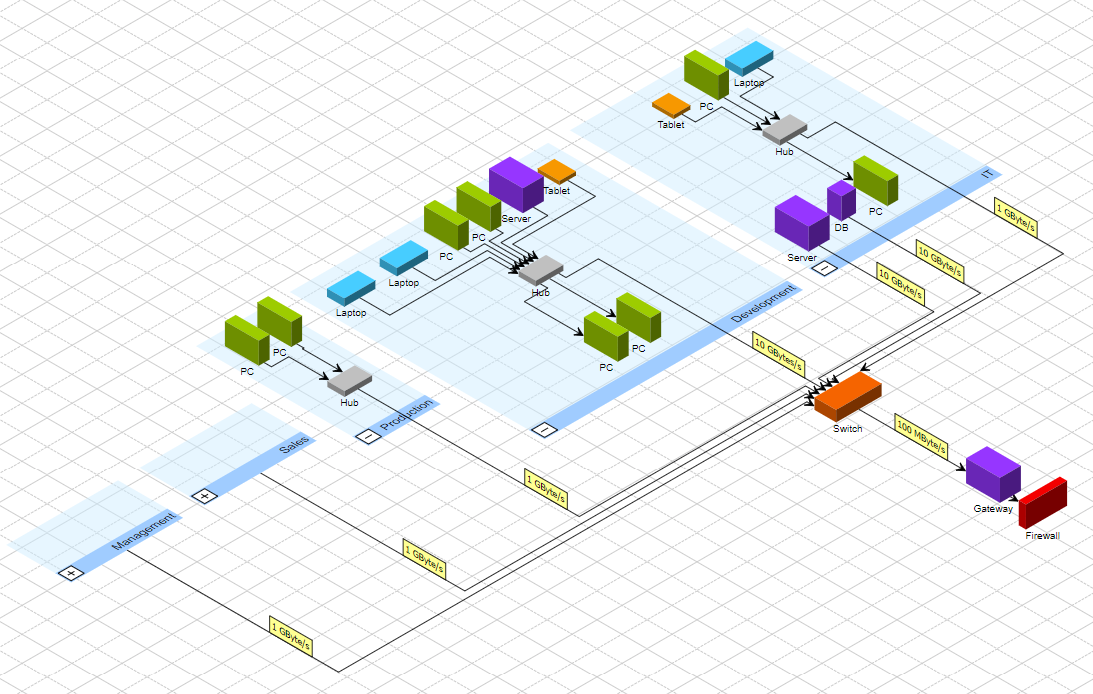
yFiles for HTML and yFiles for Java (Swing) come with an Isometric Drawing Sample Application. This example displays a computer network diagram in an isometric fashion. This diagram consists of computer and network devices, and group nodes (departments) that can be expanded and collapsed. Besides, the user can load graph files that make use of the yFiles for HTML’s predefined styles.
The source code of the Isometric Drawing Sample Application is part of several yFiles packages and available on the yWorks GitHub repository:
Isometric Drawing in Your Own Application with yFiles
Test yFiles’ isometric drawing with a fully functional trial package of yFiles for HTML or yFiles for Java (Swing).
To implement isometric drawing in your own application, start with the Isometric Drawing Sample Application that is part of the yFiles package. It’s not only a showcase application but also provides best-practice source code that you can re-use in your own project. yFiles makes it easy to customize all aspects of this application, for example include your own visualizations or load the data from your own data source.
-
Download the trial version of yFiles for HTML for your target platform at the yWorks Customer Center.
-
Navigate to the source directory of the Isometric Drawing Sample Application.
-
Explore the sample application’s features and
-
adjust its source code to match your requirements or
-
copy the source code of the features you like to your own project.
-