
Interactive Sankey Diagram Visualization
Learn how to create an interactive Sankey diagram using a professional diagramming library
Sankey diagrams are a particular type of flow diagrams in which the thickness of each edge (link) is proportional to the flow quantity that passes through it. They have many applications in science, particularly in physics and thermodynamics, where they show how energy, water, electricity, material, etc. flows within a network, but also in fields like finance where a flow of money has to be visualized.
Creating an Interactive Sankey Diagram
As mentioned above, Sankey diagrams visualize the flow within the nodes (vertices) of a network. To generate a Sankey diagram, users have to provide the information about the connections between the nodes (i.e., the edges of the Sankey diagram) along with a numerical value associated with them that will determine the thickness of each edge.
In Sankey diagrams, the nodes are usually placed into two or more columns connected by horizontal edges. The size of each node is proportional to the total thickness of the attached edges so that it becomes large enough to accommodate all of them. Nodes and edges often have different colors, which makes it easier to follow their flow.

Utilizing a Sophisticated Visualization Solution
There exist several tools that automatically create Sankey diagrams. Most of them are easy-to-use applications that can be used even by people without programming skills. As ready-to-use tools, their disadvantage is that they only support the standard features of a Sankey diagram, e.g., thickness adjustment, color adjustment for nodes and edges, and limited node arrangements and cannot be further extended.
However, there are many use case scenarios where users have advanced requirements that these standard tools cannot meet, e.g., specific constraints on node arrangements, non-trivial node or edge styles, etc. There are also cases where users already have an application in which they want to integrate a Sankey diagram. For these cases, users have to implement their own Sankey diagram tailored to their use cases and needs. Using a software library that provides ready-to-use components for this task helps developers save a lot of money, time, and workforce.
yFiles is a commercial programming library designed explicitly for diagram visualization and is a perfect fit for the generation of Sankey diagrams. yFiles provides a very sophisticated implementation of a layered graph layout algorithm that supports a large number of advanced features. It is well suited for small and large graphs and can be easily configured for drawing Sankey diagrams.
yFiles also provides an extensive set of predefined styles for visualizing the graph elements, i.e., the nodes, the edges, or the labels, while it also supports the creation of user-defined custom styles.
Users can also benefit from the extensive interaction capabilities of the library that allow creating interactive applications that provide much more functionality than a simple static representation. With yFiles, a broad set of interactive features can augment the visualization, e.g., filtering that reduces the number of displayed entities, data exploration, and interactive modification by mouse, keyboard and touch gestures, etc.
Examples and Source Code
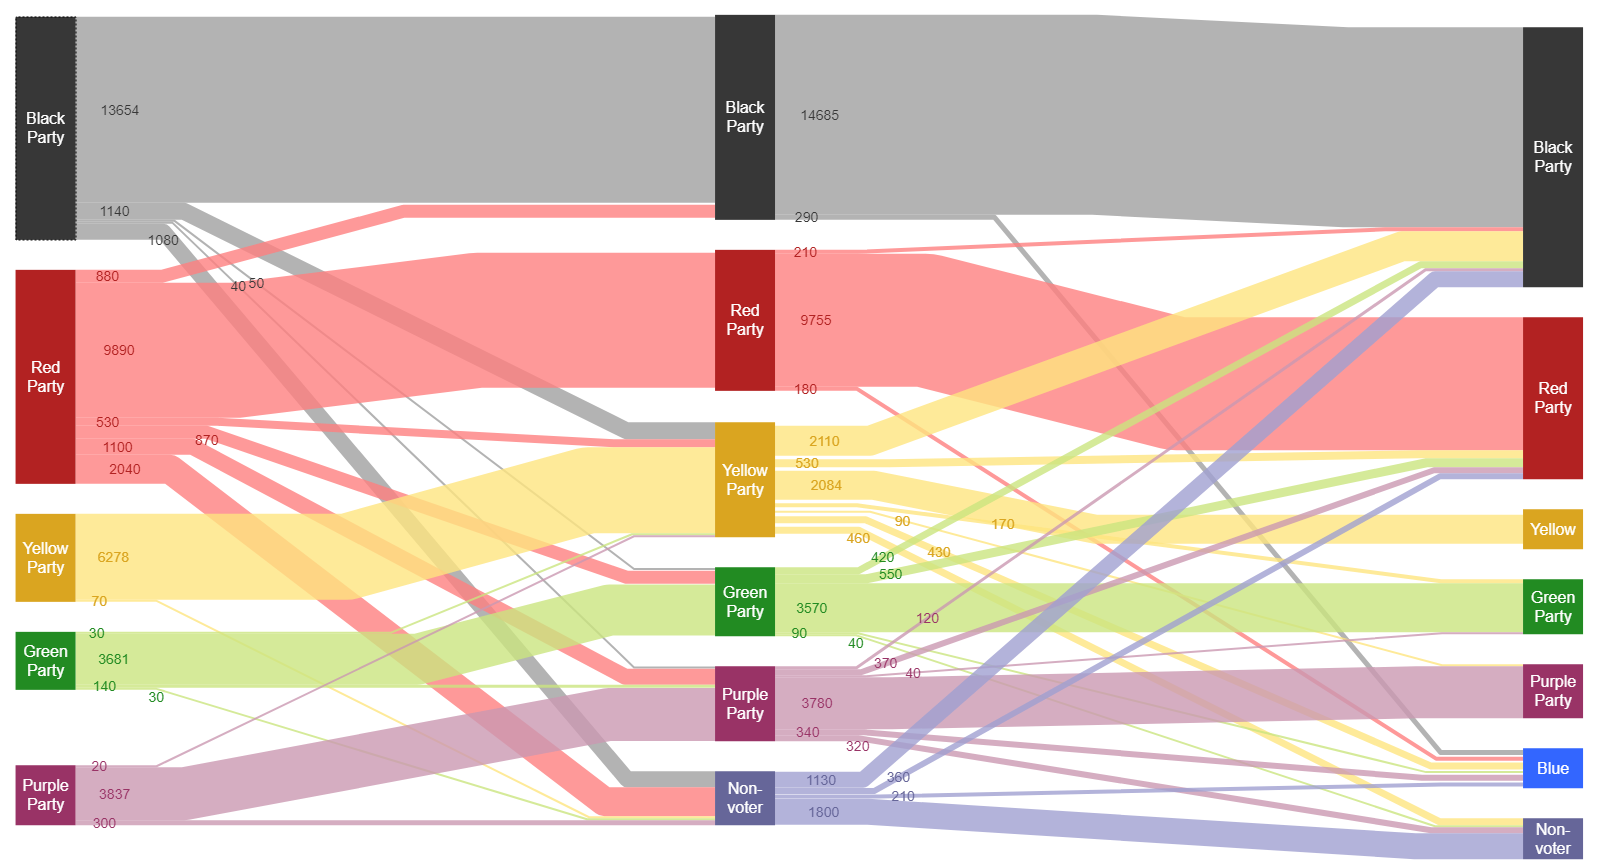
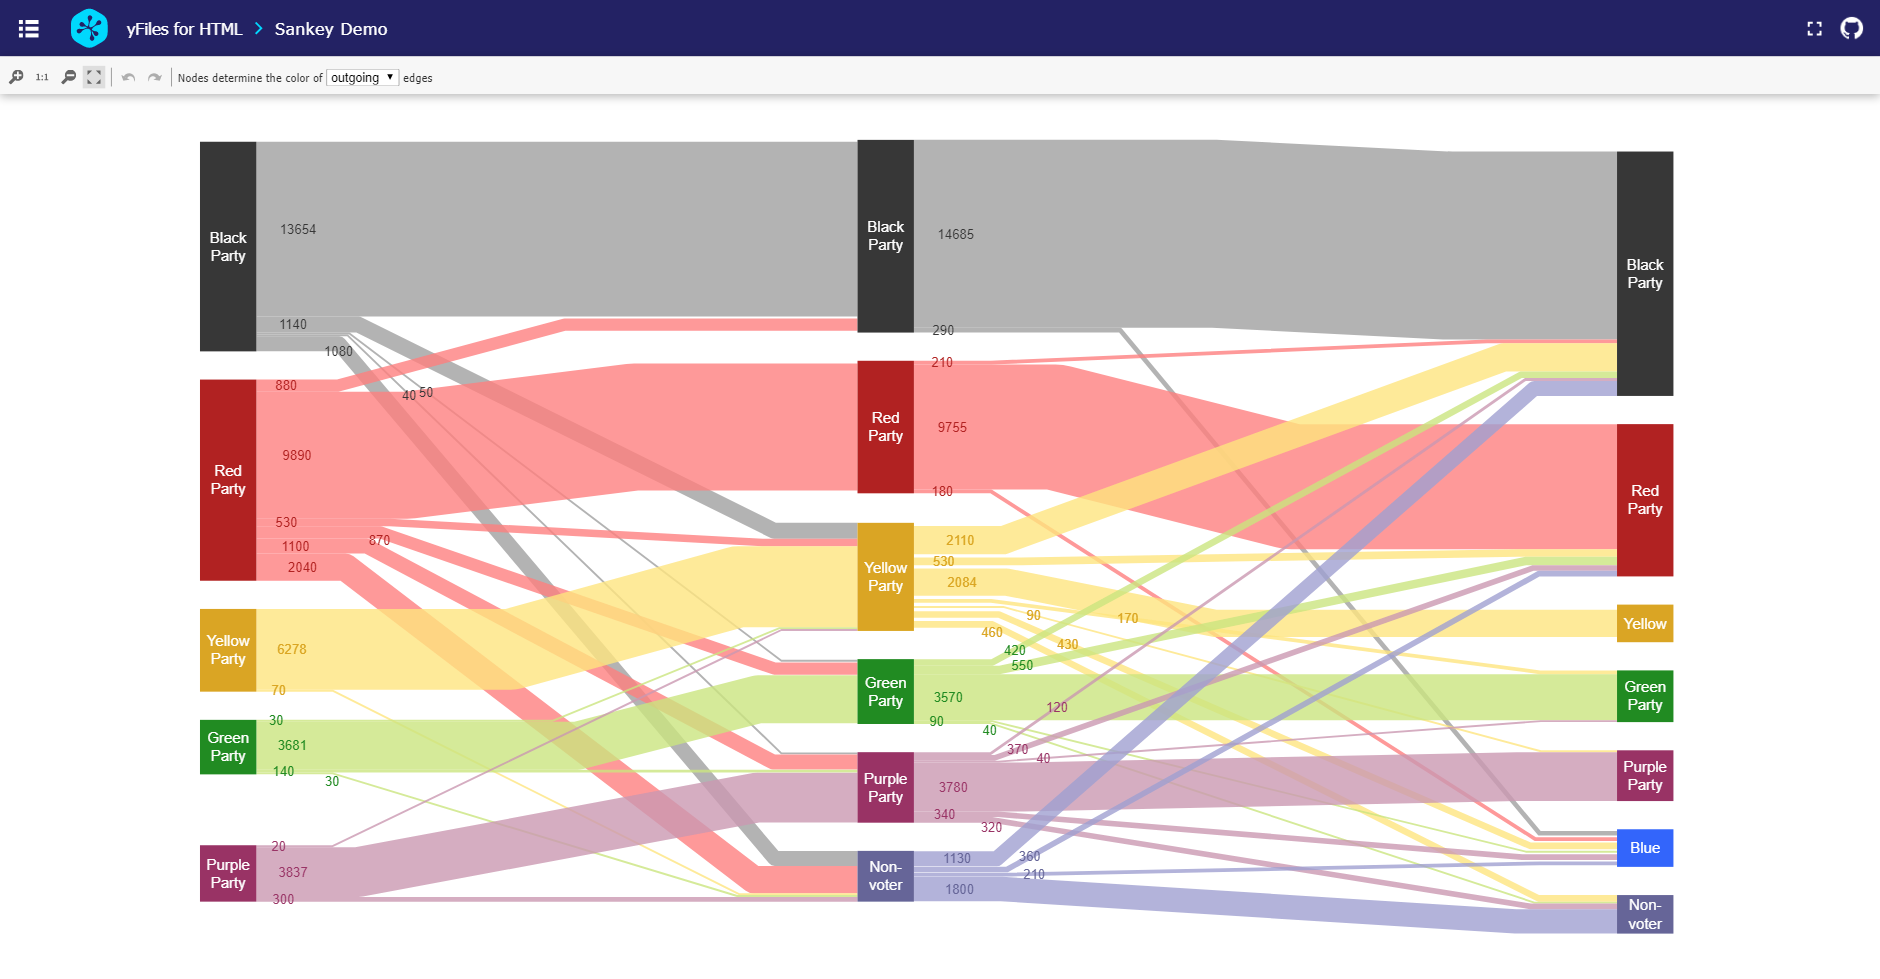
With yFiles, Sankey diagrams can be realized on all supported platforms. yFiles for HTML and yFiles for Java come with an Interactive Sankey Diagram Application which shows the voters’ migration flow between different political parties over the course of three elections.
The source code of the Interactive Sankey Diagram Application is part of these yFiles packages and available on the yWorks GitHub repository:
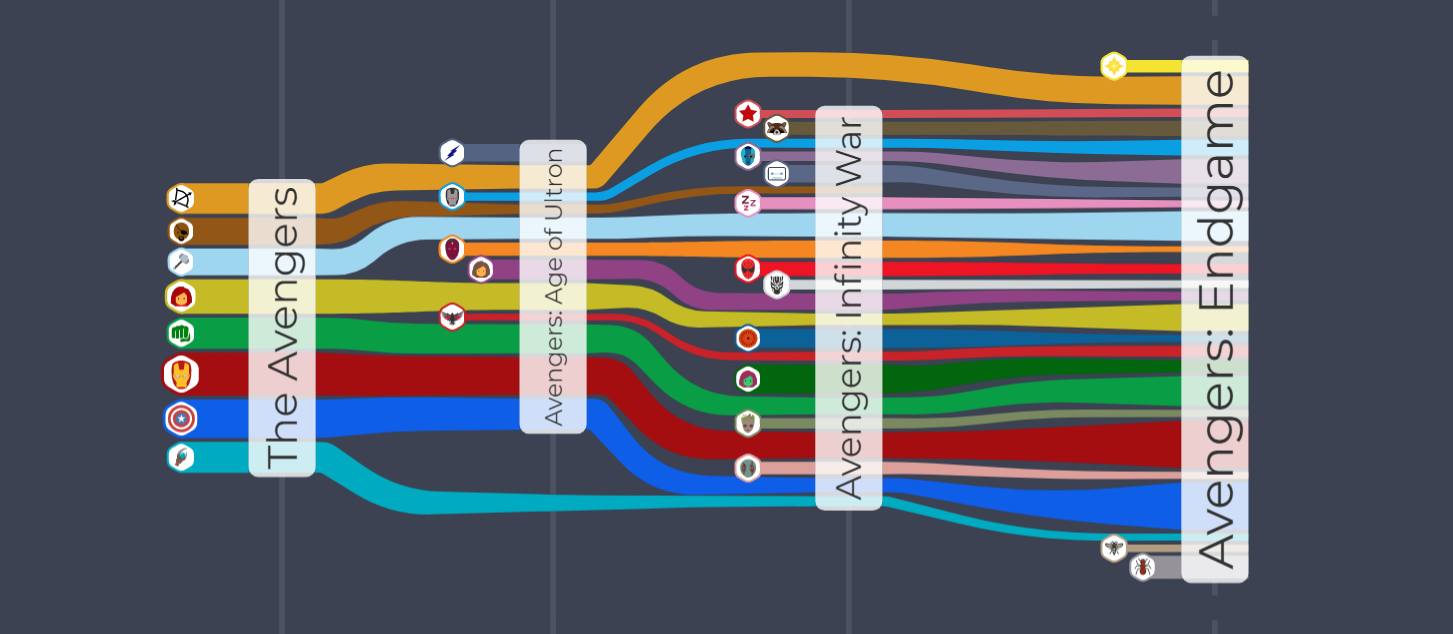
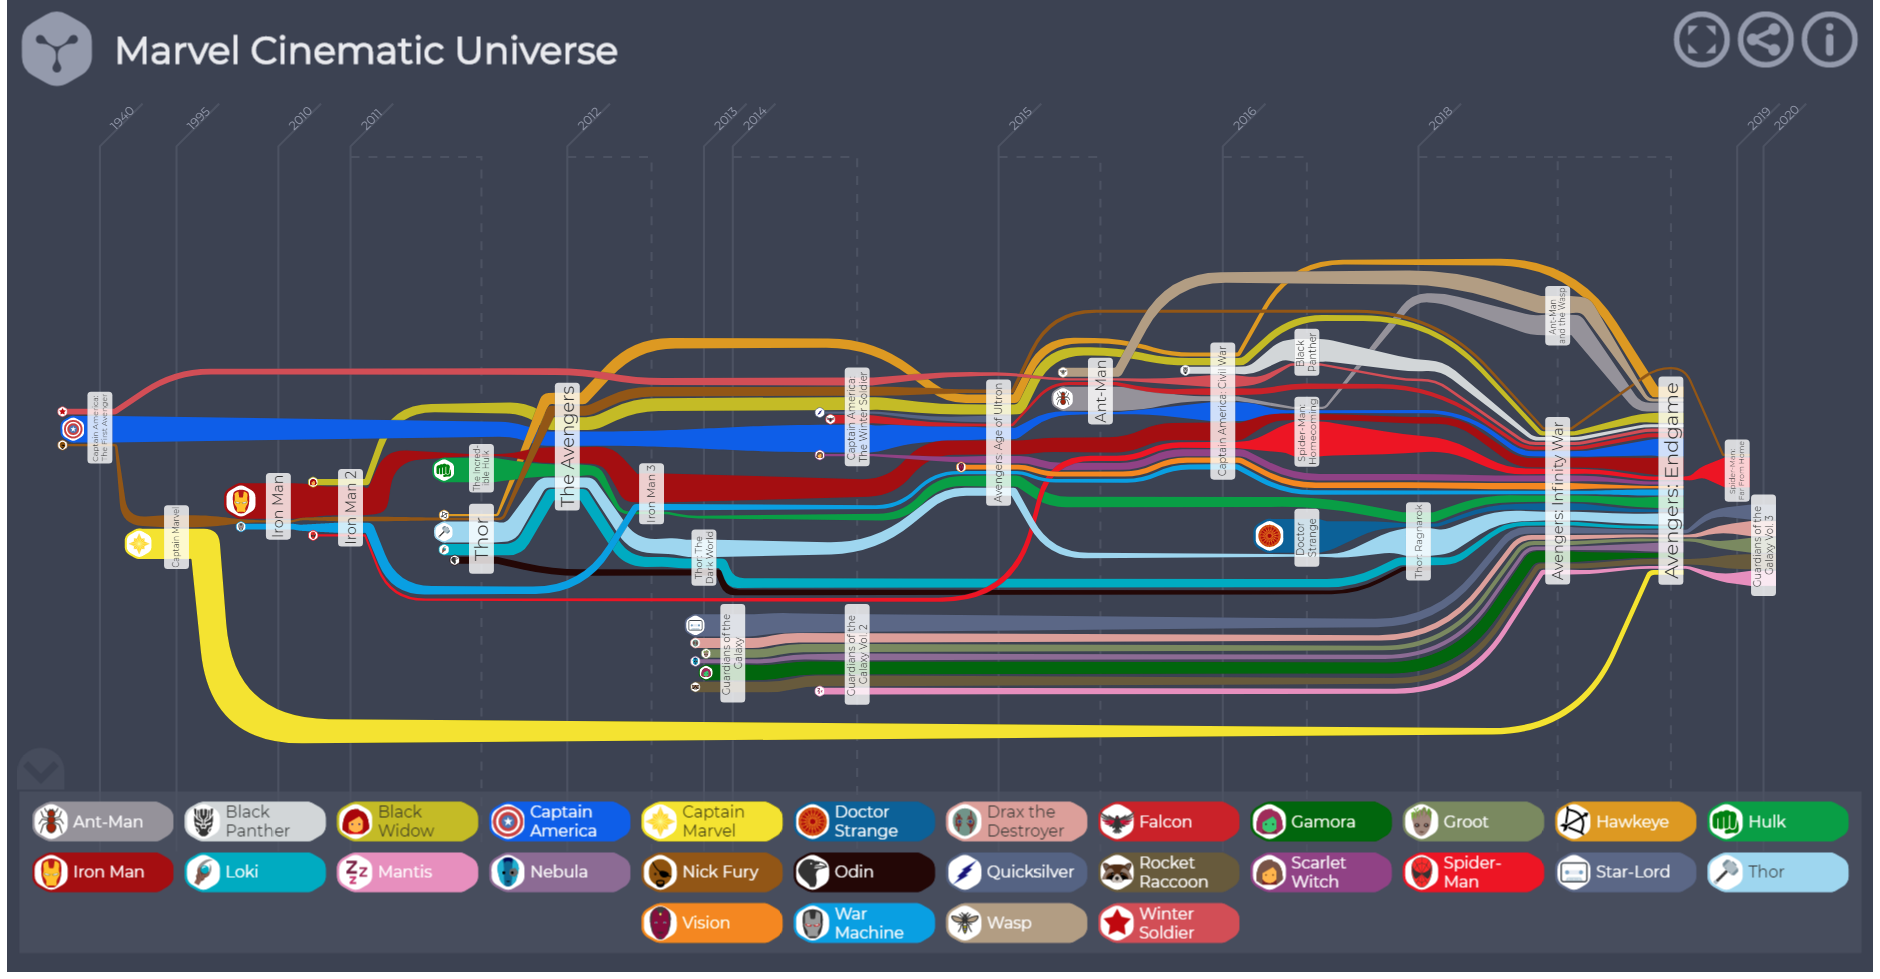
yFiles for HTML also comes with a Marvel Cinematic Universe Application based on Sankey diagrams, which visualizes the relationships between Marvel superheroes and the movies in which they appear. The thickness of the edges represents the relative screen-time of Marvel characters within each movie.
Implement Your Own Sankey Diagram Application
Test the yFiles diagramming library with a fully functional trial package. To implement your own Sankey diagram application, start with the Interactive Sankey Diagram Application that is part of the yFiles package. It’s not only a showcase application but also provides best-practice source code that you can re-use in your project. yFiles makes it easy to customize all aspects of this application, for example, restrict user interaction or adjust the style of the elements. Features like the Sankey edge visualizations and the specialized automatic layout are separate components that work in any yFiles-based project.
-
Download the trial version of yFiles for your target platform at the yWorks Customer Center.
-
Navigate to the source directory of the Interactive Sankey Diagram Application.
-
Explore the sample application’s features and
-
adjust its source code to match your requirements or
-
copy the source code of the features you like to your project.
-